Measuring disk usage and identifying processes utilising the most I/O bandwidth on a Debian Linux server.
Install Performance Monitoring Tools
Install sysstat and iotop, if not yet installed:
# apt-get update && apt-get install sysstat iotop
For RHEL/CentOS, do the following:
# yum install -y sysstat iotop
The sysstat package contains sar and iostat system performance tools which we’ll be using today.
Make sure that sar is enabled in /etc/default/sysstat. If not enabled, do it.
You may also want to change the history value in /etc/sysstat/sysstat to something different than 7 days:
HISTORY=60
Note that if value is greater than 28, then log files will be kept in multiple directories, one for each month.
By default sysstat will collect data every 10 minutes. You can change this by modifying the cronjob /etc/cron.d/sysstat.
Finally, restart the service:
# service sysstat restart
Measure Disk I/O Usage
Disk Usage with iostat
The iostat command can generate three types of reports:
- CPU utilisation report (check this post for usage).
- Device utilisation report.
- Network filesystem report.
This article is beyond the scope of using CPU and NFS utilisation reports.
Display three device utilisation (-d) reports in megabytes (-m) at one second intervals for disk sda. Note that the first report generated by the iostat gives averages since the boot time.
$ iostat -d sda -m 1 3
Linux 3.2.0-4-686-pae (flames) 	23/02/14 	_i686_	(2 CPU)

Device:         tps   MB_read/s   MB_wrtn/s   MB_read   MB_wrtn
sda           12.44        0.27        0.24    113018     97399

Device:         tps   MB_read/s   MB_wrtn/s   MB_read   MB_wrtn
sda          850.00      104.79        0.00       104         0

Device:         tps   MB_read/s   MB_wrtn/s   MB_read   MB_wrtn
sda          869.00      106.22        0.00       106         0
The following values are displayed (as per man page):
- tps: indicates the number of transfers per second that were issued to the device. A transfer is an I/O request to the device. Multiple logical requests can be combined into a single I/O request to the device.
- MB_read/s: indicates the amount of data read from the device expressed in a number of megabytes per second.
- MB_wrtn/s: indicates the amount of data written to the device expressed in megabytes per second.
- MB_read: the total number of megabytes read.
- MB_wrtn: the total number of megabytes written.
The iostat report above indicates that some application is reading data from the sda disk at ~104 MB/s.
Display three device utilisation (-d) reports of extended (-x) statistics in megabytes (-m) at one second intervals for device sda:
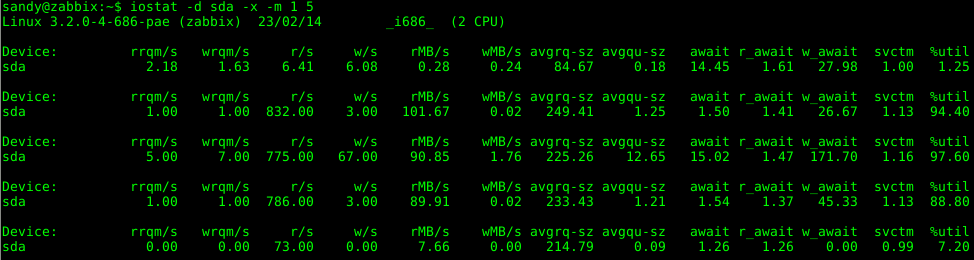
The following values are displayed (as per man page):
- rrqm/s: the number of read requests merged per second that were queued to the device.
- wrqm/s: the number of write requests merged per second that were queued to the device.
- r/s: the number (after merges) of read requests completed per second for the device.
- w/s: the number (after merges) of write requests completed per second for the device.
- rMB/s: the number of megabytes read from the device per second.
- wMB/s: the number of megabytes written to the device per second.
- avgrq-sz: the average size (in sectors) of the requests that were issued to the device.
- avgqu-sz: the average queue length of the requests that were issued to the device.
- await: the average time (in milliseconds) for I/O requests issued to the device to be served. This includes the time spent by the requests in queue and the time spent servicing them.
- r_await: the average (time in milliseconds) for read requests issued to the device to be served. This includes the time spent by the requests in queue and the time spent servicing them.
- w_await: the average time (in milliseconds) for write requests issued to the device to be served. This includes the time spent by the requests in queue and the time spent servicing them.
- svctm: the average service time (in milliseconds) for I/O requests that were issued to the device. Deprecated, will be removed in a future sysstat version.
- %util: percentage of CPU time during which I/O requests were issued to the device (bandwidth utilisation for the device).
The important fields to pay attention at when troubleshooting disk performance issues are marked in blue.
A %util value close to 100% may indicate a device saturation. This can probably be best illustrated with an SD card. For the sake of example, we’ve mounted an 8GB un-branded microSD (SDHC) card on /mnt/temp:
$ df -h | grep mmc
/dev/mmcblk0p1 7.4G 6.6G 905M 89% /mnt/temp
And then issues the following dd command to create an image.iso file on the card:
$ dd if=/dev/zero of=/mnt/temp/image.iso bs=1k count=500k
Below are the extended iostat command statistics in megabytes for the microSD device, capture while writing image.iso file to the card:
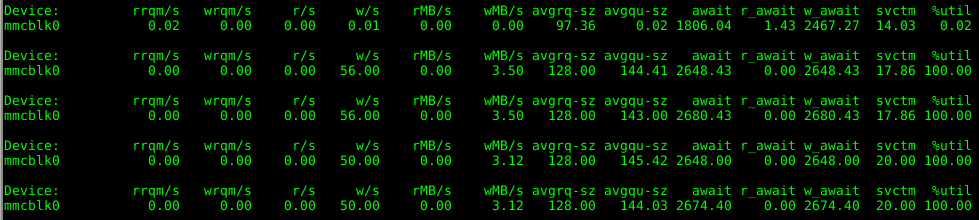
As we may notice, the average time for write requests (w_await) issued to the microSD card to be served is ~2,6 seconds. Actual write speed (wMB/s) is 3,5MB/s. CPU time (%util) is 100%, what indicates that a processor is waiting for I/O requests.
Disk Usage with iotop
The iotop command displays a dynamic real-time view for the I/O bandwidth read and written by each process. A non-interactive mode is also available. Generally speaking, iotop is a very simple to use top-like disk I/O monitor.
Display three iterations (-n3) at one second intervals (-d1) only showing (-o) processes or threads actually doing I/O and printing column names on the first iteration (-q):
# iotop -o -q -d1 -n3
Total DISK READ:      32.61 M/s | Total DISK WRITE:       0.00 B/s
  TID  PRIO  USER     DISK READ  DISK WRITE  SWAPIN      IO    COMMAND
 3892 be/4 sandy      33.94 M/s    0.00 B/s  0.00 %  0.00 % dd if=/tmp/image.iso of=/dev/null
Total DISK READ:     103.46 M/s | Total DISK WRITE:       0.00 B/s
 3892 be/4 sandy     103.46 M/s    0.00 B/s  0.00 % 25.10 % dd if=/tmp/image.iso of=/dev/null
Total DISK READ:     102.81 M/s | Total DISK WRITE:       0.00 B/s
 3892 be/4 sandy     102.69 M/s    0.00 B/s  0.00 % 27.24 % dd if=/tmp/image.iso of=/dev/null
If no parameters are passed, iotop starts in interactive mode.
Disk Usage with vmstat
I think I won’t be wrong saying that the vmstat command is not one of those tools you would use to troubleshoot disk I/O performance. However, it’s superb for getting an overall idea of what’s happening on a system.
The vm mode of vmstat displays a very basic information regards disk usage:
$ vmstat 1 3
procs -----------memory---------- ---swap-- -----io---- -system-- ----cpu----
 r  b   swpd   free   buff  cache   si   so    bi    bo   in   cs us sy id wa
 1  0  33300  15648  64196 589664    0    0     6    33   27    2  2  1 97  1
 0  1  33300  14160  64196 590976    0    0 99572     0 1421 2076  9 31 48 11
 1  0  33300  14036  64180 590956    0    0 98484     0 1450 2092  8 31 49 12
I/O activity is marked in blue. The following values are displayed:
- bi: blocks received from a block device (blocks/s).
- bo: blocks sent to a block device (blocks/s).
What I really like about vmstat is the ability to show detailed statistics about partitions (-p):
$ vmstat -p sda2
sda2          reads   read sectors  writes    requested writes
             2901080  269345106    3152170  240487152
The values displayed have these meanings:
- reads: total number of reads issued to this partition.
- read sectors: total read sectors for partition.
- writes: total number of writes issued to this partition.
- requested writes: total number of write requests made for partition.
Disk Usage with sar
Sar is an awesome tool used to collect, report and save system activity information. Sar can display real-time usage as well as extract historical data for troubleshooting and/or capacity planning purposes.
Display three pretty-printed (-p) block devices (-d) activity reports at one second intervals:
$ sar -d -p 1 3
Linux 3.2.0-4-686-pae (flames) 	24/02/14 	_i686_	(2 CPU)

20:20:19  DEV      tps  rd_sec/s  wr_sec/s  avgrq-sz  avgqu-sz  await  svctm  %util
20:20:20  sda   911.00 232936.00      0.00    255.69      1.15   1.27   1.06  96.40

20:20:20  DEV      tps  rd_sec/s  wr_sec/s  avgrq-sz  avgqu-sz  await  svctm  %util
20:20:21  sda   904.00 230880.00      0.00    255.40      1.16   1.28   1.06  96.00

20:20:21  DEV      tps  rd_sec/s  wr_sec/s  avgrq-sz  avgqu-sz  await  svctm  %util
20:20:22  sda   896.00 228864.00     48.00    255.48      1.24   1.31   1.08  96.80

Average:  DEV      tps  rd_sec/s  wr_sec/s  avgrq-sz  avgqu-sz  await  svctm  %util
Average:  sda   903.67 230893.33     16.00    255.52      1.18   1.29   1.07  96.40
The report shows the following fields (as per man page):
- tps: indicate the number of transfers per second that were issued to the device.
- rd_sec/s: number of sectors read from the device. The size of a sector is 512 bytes.
- wr_sec/s: number of sectors written to the device. The size of a sector is 512 bytes.
- avgrq-sz: the average size (in sectors) of the requests that were issued to the device.
- avgqu-sz: the average queue length of the requests that were issued to the device.
- await: the average time (in milliseconds) for I/O requests issued to the device to be served. This includes the time spent by the requests in queue and the time spent servicing them.
- svctm: the average service time (in milliseconds) for I/O requests that were issued to the device. Deprecated, will be removed in a future sysstat version.
- %util: percentage of CPU time during which I/O requests were issued to the device (bandwidth utilisation for the device). Device saturation occurs when this value is close to 100%.
As you may notice, the majority of values reported by “sar -d” command are identical to “iostat -d”. On the other had, sar has another advantage – ability to extract historical data.
Extract pretty-printed (-p) block devices (-d) historical statistics records starting (-s) 1 PM and ending (-e) 2 PM time interval:
$ sar -d -p -s 13:00:00 -e 14:00:00
Linux 3.2.0-4-686-pae (flames) 	24/02/14 	_i686_	(2 CPU)

13:05:01   DEV    tps  rd_sec/s  wr_sec/s  avgrq-sz  avgqu-sz  await  svctm  %util
13:15:01   sda   5.37      0.00    295.39     55.02      0.02   3.95   1.29   0.69
13:25:01   sda   5.44      0.00    299.61     55.03      0.02   4.18   1.33   0.72
13:35:01   sda   5.14      0.00    287.16     55.83      0.02   4.10   1.34   0.69
13:45:01   sda   5.43      0.00    298.31     54.94      0.02   4.10   1.22   0.66
13:55:01   sda   5.54      0.00    305.46     55.12      0.02   3.96   1.24   0.69
Average:   sda   5.39      0.00    297.19     55.18      0.02   4.06   1.28   0.69
Sar can also report I/O and transfer rate statistics (-b) as well as paging statistics (-B), check sar’s info page for more man.
Related Posts
Measure and Troubleshoot Linux CPU Resource Usage
Measure and Troubleshoot Linux Memory Resource Usage
Measure and Troubleshoot Linux Network Resource Usage
Lisenet never disappoints when it comes to deep-dive Linux engineering. Breaking down the precise metrics of iostat (like %util and await) alongside iotop makes tracking down rogue processes causing high I/O wait times so much easier. Excellent structural breakdown!