We are going to configure Prometheus to monitor Etcd cluster.
Pre-requisites
We are using our Kubernetes homelab in this article.
Configure Etcd Metrics URL
By default, Etcd cluster metrics are exposed locally. You can get the metrics endpoint URL by checking the file /etc/kubernetes/manifests/etcd.yaml on an Etcd cluster.
$ grep metrics /etc/kubernetes/manifests/etcd.yaml
    - --listen-metrics-urls=http://127.0.0.1:2381
What we want to do is to make the metrics URL accessible from our local network so that we can configure Prometheus to use static configs.
For each of our control plane nodes, we are going to add an additional endpoint that resolves to the server’s internal IP address like this:
--listen-metrics-urls=http://127.0.0.1:2381,http://10.11.1.31:2381
Configure Prometheus Scraping
Add the following to your Prometheus config map and restart the pod:
  - job_name: 'etcd'
    static_configs:
      - targets: ['10.11.1.31:2381','10.11.1.32:2381','10.11.1.33:2381']
Add Grafana Dashboard for Etcd
Install a dashboard to monitor Etcd: https://grafana.com/grafana/dashboards/3070
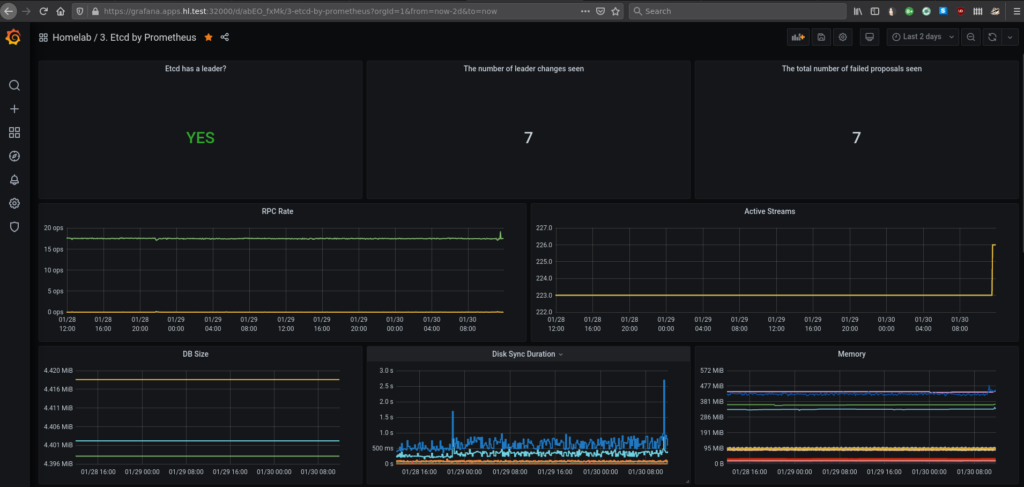
The end result should look something like this: