We are going to install bind_exporter and configure Prometheus to monitor Bind DNS servers.
The bind_exporter service exports Bind service metrics to Prometheus.
Pre-requisites
We are using our Kubernetes homelab in this article.
We have two Bind servers, admin1 and admin2, that provide DNS services to the homelab environment.
Install and Configure Bind Exporter
Ansible Playbook to Configure Bind Exporter
I use Ansible to manage my homelab, including Bind servers and bind_exporter.
Below is an excerpt from the file main.yml of the Ansible role that manages Bind.
- name: Ensure group {{ prometheus_user }} exists
  group:
    state: present
    system: yes
    name: "{{ prometheus_user }}"

- name: Create user {{ prometheus_user }}
  user:
    state: present
    system: yes
    name: "{{ prometheus_user }}"
    groups: "{{ prometheus_user }}"
    shell: "/sbin/nologin"

- name: Open Bind exporter firewall port tcp {{ bind_exporter_port }}
  firewalld:
    immediate: yes
    permanent: yes
    state: enabled
    port: "{{ bind_exporter_port }}/tcp"

- name: Unarchive a file that needs to be downloaded
  unarchive:
    src: "{{ bind_exporter_url }}"
    dest: "/usr/local/bin"
    remote_src: yes
    owner: root
    group: root
    creates: "/usr/local/bin/{{ bind_exporter_binary }}"
    extra_opts:
      - "--strip-components"
      - "1"

- name: Copy {{ bind_exporter_systemd_service }}
  template:
    src: "{{ bind_exporter_systemd_service }}.j2"
    dest: "/etc/systemd/system/{{ bind_exporter_systemd_service }}"
    owner: root
    group: root
    mode: "0644"

- name: systemctl daemon-reload
  command: systemctl daemon-reload

- name: Start and enable service {{ bind_exporter_systemd_service }}
  service:
    name: "{{ bind_exporter_systemd_service }}"
    state: started
    enabled: yes
We are going to break it down in to tasks.
Create a User/Group
We are going to create a user/group called “prometheus” to run the systemd service as.
Run the following commands on Bind servers:
$ sudo groupadd prometheus
$ sudo useradd --system -s /sbin/nologin -g prometheus prometheus
Configure Firewall
Configure firewall to allow inbound access on a TCP port 9153.
Run the following commands on Bind servers:
$ sudo firewall-cmd --permanent --add-port=9153/tcp
$ sudo firewall-cmd --reload
Install bind_exporter
Run the following commands on Bind servers:
$ wget -q https://github.com/prometheus-community/bind_exporter/releases/download/v0.3.0/bind_exporter-0.3.0.linux-amd64.tar.gz
$ sudo tar --strip-components=1 -xf bind_exporter-0.3.0.linux-amd64.tar.gz -C /usr/local/bin/
$ sudo chown -R root: /usr/local/bin/
Create bind_exporter Systemd Service
Create a file /etc/systemd/system/bind_exporter.service on Bind servers with the following content:
[Unit]
Description=Prometheus
Documentation=https://github.com/prometheus-community/bind_exporter
Wants=network-online.target
After=network-online.target

[Service]
Type=simple
User=prometheus
Group=prometheus
ExecReload=/bin/kill -HUP $MAINPID
ExecStart=/usr/local/bin/bind_exporter \
  --bind.pid-file=/var/run/named/named.pid \
  --bind.timeout=20s \
  --web.listen-address=0.0.0.0:9153 \
  --web.telemetry-path=/metrics \
  --bind.stats-url=http://127.0.0.1:8053/ \
  --bind.stats-groups=server,view,tasks

SyslogIdentifier=prometheus
Restart=always

[Install]
WantedBy=multi-user.target
Set appropriate permissions:
$ sudo chown -R root: /etc/systemd/system/bind_exporter.service
$ sudo chmod 0644 /etc/systemd/system/bind_exporter.service
Enable and start the service:
$ sudo systemctl daemon-reload
$ sudo systemctl enable --now bind_exporter
Note that we still have to configure Bind to export statistics.
Configure Bind Server to Export Statistics
Add the following to your Bind server configuration file /etc/named.conf:
statistics-channels {
	inet 127.0.0.1 port {{ bind_statistics_port }} allow { 127.0.0.1; };
};
Restart the service:
$ sudo systemctl restart named
Configure Prometheus Scraping
Add the following to your Prometheus config map and restart the pod:
  - job_name: 'dns-master'
    static_configs:
      - targets: ['10.11.1.2:9153']
        labels:
          alias: admin1
  - job_name: 'dns-slave1'
    static_configs:
      - targets: ['10.11.1.3:9153']
        labels:
          alias: admin2
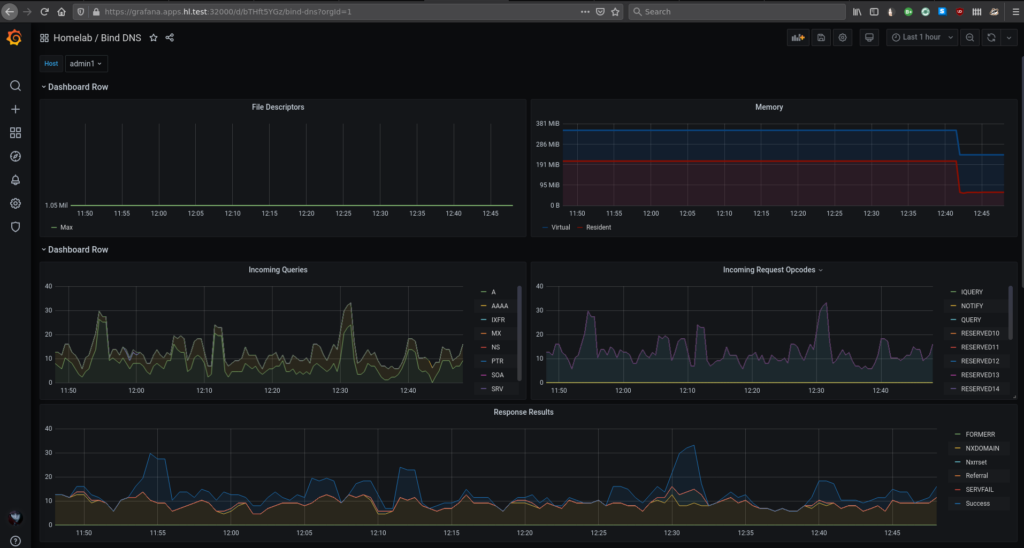
Add Grafana Dashboard for Bind
Install a dashboard to monitor Bind: https://grafana.com/grafana/dashboards/1666
The end result should look something like this:
References
https://github.com/prometheus-community/bind_exporter