We are going to install haproxy_exporter and configure Prometheus to monitor HAProxy servers.
The haproxy_exporter service scrapes HAProxy stats and exports them via HTTP for Prometheus consumption.
Pre-requisites
We are using our Kubernetes homelab in this article.
We have two HAProxy servers, admin1 and admin2, that provide load balancing services to the homelab Kubernetes cluster.
Install and Configure HAProxy Exporter
Ansible Playbook to Configure HAproxy Exporter
I use Ansible to manage my homelab, including HAProxy servers and haproxy_exporter.
Below is an excerpt from the file main.yml of the Ansible role that manages HAproxy.
- name: Ensure group {{ prometheus_user }} exists
  group:
    state: present
    system: yes
    name: "{{ prometheus_user }}"

- name: Create user {{ prometheus_user }}
  user:
    state: present
    system: yes
    name: "{{ prometheus_user }}"
    groups: "{{ prometheus_user }}"
    shell: "/sbin/nologin"

- name: Open HAProxy exporter firewall port tcp {{ haproxy_exporter_port }}
  firewalld:
    immediate: yes
    permanent: yes
    state: enabled
    port: "{{ haproxy_exporter_port }}/tcp"

- name: Unarchive a file that needs to be downloaded
  unarchive:
    src: "{{ haproxy_exporter_url }}"
    dest: "/usr/local/bin"
    remote_src: yes
    owner: root
    group: root
    creates: "/usr/local/bin/{{ haproxy_exporter_binary }}"
    extra_opts:
      - "--strip-components"
      - "1"

- name: Copy {{ haproxy_exporter_systemd_service }}
  template:
    src: "{{ haproxy_exporter_systemd_service }}.j2"
    dest: "/etc/systemd/system/{{ haproxy_exporter_systemd_service }}"
    owner: root
    group: root
    mode: "0644"

- name: systemctl daemon-reload
  command: systemctl daemon-reload

- name: Start and enable service {{ haproxy_exporter_systemd_service }}
  service:
    name: "{{ haproxy_exporter_systemd_service }}"
    state: started
    enabled: yes
We are going to break it down in to tasks.
Create a User/Group
We are going to create a user/group called “prometheus” to run the systemd service as.
Run the following commands on HAProxy servers:
$ sudo groupadd prometheus
$ sudo useradd --system -s /sbin/nologin -g prometheus prometheus
Configure Firewall
Configure firewall to allow inbound access on a TCP port 9101.
Run the following commands on HAProxy servers:
$ sudo firewall-cmd --permanent --add-port=9101/tcp
$ sudo firewall-cmd --reload
Install haproxy_exporter
Run the following commands on HAProxy servers:
$ wget -q https://github.com/prometheus/haproxy_exporter/releases/download/v0.12.0/haproxy_exporter-0.12.0.linux-amd64.tar.gz
$ sudo tar --strip-components=1 -xf haproxy_exporter-0.12.0.linux-amd64.tar.gz -C /usr/local/bin/
$ sudo chown -R root: /usr/local/bin/
Create haproxy_exporter Systemd Service
Create a file /etc/systemd/system/haproxy_exporter.service on HAProxy servers with the following content:
[Unit]
Description=Prometheus
Documentation=https://github.com/prometheus/haproxy_exporter
Wants=network-online.target
After=network-online.target

[Service]
Type=simple
User=prometheus
Group=prometheus
ExecReload=/bin/kill -HUP $MAINPID
ExecStart=/usr/local/bin/haproxy_exporter \
  --haproxy.pid-file=/var/run/haproxy.pid \
  --haproxy.timeout=20s \
  --web.listen-address=0.0.0.0:9101 \
  --web.telemetry-path=/metrics \
  '--haproxy.scrape-uri=http://admin:[email protected]:8080/stats;csv'

SyslogIdentifier=prometheus
Restart=always

[Install]
WantedBy=multi-user.target
Set appropriate permissions:
$ sudo chown -R root: /etc/systemd/system/haproxy_exporter.service
$ sudo chmod 0644 /etc/systemd/system/haproxy_exporter.service
Enable and start the service:
$ sudo systemctl daemon-reload
$ sudo systemctl enable --now haproxy_exporter
Note that we still have to configure HAProxy to export statistics.
Configure HAProxy Server to Export Statistics
Add the following to your HAProxy server configuration file /etc/haproxy/haproxy.cfg:
listen stats
    bind 10.11.1.30:8080
    mode http
    stats enable
    stats uri /
    stats refresh 30s
    stats realm HAProxy\ Statistics
    stats auth admin:haproxy
Restart the service:
$ sudo systemctl restart haproxy
Configure Prometheus Scraping
Add the following to your Prometheus config map and restart the pod:
  - job_name: 'haproxy'
    static_configs:
      - targets: ['10.11.1.30:9101']
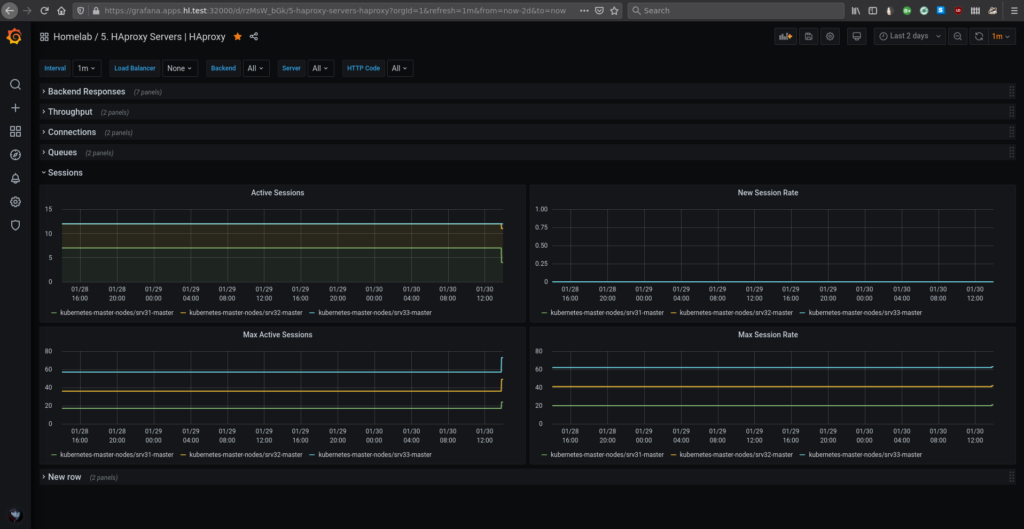
Add Grafana Dashboard for HAProxy
Install a dashboard to monitor HAProxy: https://grafana.com/grafana/dashboards/367
The end result should look something like this:
References
https://github.com/prometheus/haproxy_exporter
Thank you for this tutorial so if you have 02 servers haproxy and you want to config haproxy exporter service for les both haproxy how to do it
You’re welcome! If you have more than one HAProxy server, then you need to install the exporter on all of them.
Had an issue starting the service with the below errors
-parsing [/etc/haproxy/haproxy.cfg:xx] : ‘listen’ or ‘defaults’ expected.
-ALERT] (1899) : Error(s) found in configuration file : /etc/haproxy/haproxy.cfg
-Fatal errors found in configuration.
-parsing [/etc/haproxy/haproxy.cfg:27] : please use the ‘bind’ keyword for listening addresses.
Solved it below by modifying as below
listen stats
bind x.x.x.x:8080
mode http
stats enable
stats uri /
stats realm HAProxy\ Statistics
stats auth admin:haproxy
Thanks. That change is in the GitHub repository already, including SSL configuration:
https://github.com/lisenet/homelab-ansible/blob/master/roles/hl.haproxy/templates/haproxy.cfg.j2
I will update the article.