We are going to deploy Prometheus to monitor Kubernetes nodes and more.
Pre-requisites
We are using our Kubernetes homelab to deploy Prometheus.
A working NFS server is required to create persistent volumes. Note that NFS server configuration is not covered in this article, but the way we set it up can be found here.
Our NFS server IP address is 10.11.1.20, and we have the following export configured for Prometheus:
/mnt/storage-k8s/nfs/prometheus
The owner:group of the NFS folder is set to 65534:65534, because of Prometheus deployment runAsUser: 65534.
Download Files from GitHub
Configuration files used in this article are hosted on GitHub. Clone the following repository:
$ git clone https://github.com/lisenet/kubernetes-homelab.git
$ cd ./kubernetes-homelab/
TLDR; Install and Configure Prometheus: All in One Go
Create a monitoring namespace:
$ kubectl create ns monitoring
Create everything with a single command:
$ kubectl apply -f ./kubernetes/prometheus/
Note to self: this could be a Helm chart.
Install and Configure Prometheus: Step by Step
Step by step instructions. Note that this homelab project is under development, therefore please refer to GitHub for any source code changes.
Create a Namespace
Create a monitoring namespace:
$ kubectl create ns monitoring
Create a Cluster Role and a Cluster Role Binding
Allow Prometheus fetch metrics from Kubernetes API:
$ kubectl apply -f ./kubernetes/prometheus/prometheus-cluster-role.yml
This is what the code looks like:
---
apiVersion: rbac.authorization.k8s.io/v1
kind: ClusterRole
metadata:
  name: prometheus
rules:
- apiGroups: [""]
  resources:
  - nodes
  - nodes/proxy
  - services
  - endpoints
  - pods
  verbs: ["get", "list", "watch"]
- apiGroups:
  - extensions
  resources:
  - ingresses
  verbs: ["get", "list", "watch"]
- nonResourceURLs: ["/metrics"]
  verbs: ["get"]
---
apiVersion: rbac.authorization.k8s.io/v1
kind: ClusterRoleBinding
metadata:
  name: prometheus
roleRef:
  apiGroup: rbac.authorization.k8s.io
  kind: ClusterRole
  name: prometheus
subjects:
- kind: ServiceAccount
  name: default
  namespace: monitoring
Create a Config Map
Prometheus scrapes metrics from instrumented jobs. The config map is the place to define your scrape config, what needs monitoring and how often.
My scrape config will not match yours, and it is therefore important that you modify the file prometheus-config-map.yml to meet your environment needs.
$ kubectl apply -f ./kubernetes/prometheus/prometheus-config-map.yml
This is what the code looks like:
---
apiVersion: v1
kind: ConfigMap
metadata:
name: prometheus-server-conf
labels:
name: prometheus-server-conf
namespace: monitoring
data:
prometheus.rules: |-
groups:
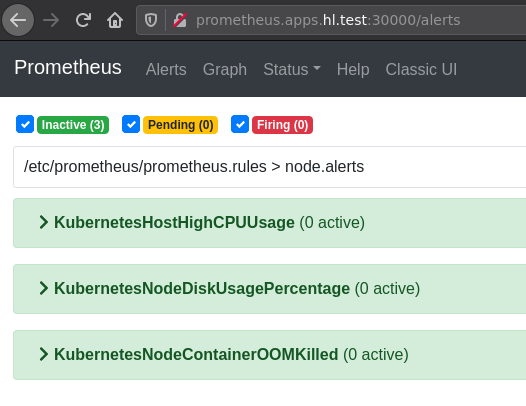
- name: node.alerts
rules:
- alert: KubernetesHostHighCPUUsage
expr: 100 - (avg by (instance) (irate(node_cpu_seconds_total{mode="idle"}[5m])) * 100) > 90
for: 15m
labels:
severity: warning
context: node
annotations:
summary: High load on node
description: "Node {{ $labels.instance }} has more than 90% CPU load"
- alert: KubernetesNodeDiskUsagePercentage
expr: (100 - 100 * sum(node_filesystem_avail_bytes{device!~"tmpfs|by-uuid",fstype=~"xfs|ext"} / node_filesystem_size_bytes{device!~"tmpfs|by-uuid",fstype=~"xfs|ext"}) BY (instance,device)) > 85
for: 5m
labels:
severity: warning
context: node
annotations:
description: Node disk usage above 85%
summary: Disk usage on target {{ $labels.instance }} at 85%
- alert: KubernetesNodeContainerOOMKilled
expr: sum by (instance) (changes(node_vmstat_oom_kill[24h])) > 3
labels:
severity: warning
context: node
annotations:
description: More than 3 OOM killed pods on a node within 24h
summary: More than 3 OOM killed pods on node {{ $labels.instance }} within 24h
prometheus.yml: |-
global:
evaluation_interval: 60s
scrape_interval: 15s
scrape_timeout: 10s
rule_files:
- /etc/prometheus/prometheus.rules
# Alertmanager configuration
alerting:
alertmanagers:
- static_configs:
- targets:
- 'alertmanager.monitoring.svc:9093'
scrape_configs:
- job_name: 'kubernetes-apiservers'
kubernetes_sd_configs:
- role: endpoints
scheme: https
tls_config:
ca_file: /var/run/secrets/kubernetes.io/serviceaccount/ca.crt
bearer_token_file: /var/run/secrets/kubernetes.io/serviceaccount/token
relabel_configs:
- source_labels: [__meta_kubernetes_namespace, __meta_kubernetes_service_name, __meta_kubernetes_endpoint_port_name]
action: keep
regex: default;kubernetes;https
#--------------------------------------------
# Scrape config for nodes (kubelet).
#--------------------------------------------
- job_name: 'kubernetes-nodes'
kubernetes_sd_configs:
- role: node
relabel_configs:
- action: labelmap
regex: __meta_kubernetes_node_label_(.+)
- target_label: __address__
replacement: kubernetes.default.svc:443
- source_labels: [__meta_kubernetes_node_name]
regex: (.+)
target_label: __metrics_path__
replacement: /api/v1/nodes/${1}/proxy/metrics
scheme: https
tls_config:
ca_file: /var/run/secrets/kubernetes.io/serviceaccount/ca.crt
bearer_token_file: /var/run/secrets/kubernetes.io/serviceaccount/token
#--------------------------------------------
# Scrape config for service endpoints. This will
# scrape node-exporter and kube-state-metrics services.
# You need this for the following Grafana dashboards:
# - Kubernetes Cluster Summary
# - Node Exporter Full
#--------------------------------------------
- job_name: kubernetes-service-endpoints
kubernetes_sd_configs:
- role: endpoints
relabel_configs:
- action: keep
regex: true
source_labels:
- __meta_kubernetes_service_annotation_prometheus_io_scrape
- action: replace
regex: (https?)
source_labels:
- __meta_kubernetes_service_annotation_prometheus_io_scheme
target_label: __scheme__
- action: replace
regex: (.+)
source_labels:
- __meta_kubernetes_service_annotation_prometheus_io_path
target_label: __metrics_path__
- action: replace
regex: ([^:]+)(?::\d+)?;(\d+)
replacement: $1:$2
source_labels:
- __address__
- __meta_kubernetes_service_annotation_prometheus_io_port
target_label: __address__
- action: labelmap
regex: __meta_kubernetes_service_label_(.+)
- action: replace
source_labels:
- __meta_kubernetes_namespace
target_label: kubernetes_namespace
- action: replace
source_labels:
- __meta_kubernetes_service_name
target_label: kubernetes_name
- action: replace
source_labels:
- __meta_kubernetes_pod_node_name
target_label: kubernetes_node
#--------------------------------------------
# Scrape config for pods.
#--------------------------------------------
- job_name: 'kubernetes-pods'
kubernetes_sd_configs:
- role: pod
relabel_configs:
- source_labels: [__meta_kubernetes_pod_annotation_prometheus_io_scrape]
action: keep
regex: true
- source_labels: [__meta_kubernetes_pod_annotation_prometheus_io_path]
action: replace
target_label: __metrics_path__
regex: (.+)
- source_labels: [__address__, __meta_kubernetes_pod_annotation_prometheus_io_port]
action: replace
regex: ([^:]+)(?::\d+)?;(\d+)
replacement: $1:$2
target_label: __address__
- action: labelmap
regex: __meta_kubernetes_pod_label_(.+)
- source_labels: [__meta_kubernetes_namespace]
action: replace
target_label: kubernetes_namespace
- source_labels: [__meta_kubernetes_pod_name]
action: replace
target_label: kubernetes_pod_name
#--------------------------------------------
# Scrape static config for homelab.
#--------------------------------------------
- job_name: 'dns-master'
static_configs:
- targets: ['10.11.1.2:9153']
labels:
alias: admin1
- job_name: 'dns-slave1'
static_configs:
- targets: ['10.11.1.3:9153']
labels:
alias: admin2
- job_name: 'etcd'
static_configs:
- targets: ['10.11.1.31:2381','10.11.1.32:2381','10.11.1.33:2381']
- job_name: 'haproxy'
static_configs:
- targets: ['10.11.1.30:9101']
- job_name: 'admin1'
static_configs:
- targets: ['10.11.1.2:9100']
labels:
alias: admin1
- job_name: 'admin2'
static_configs:
- targets: ['10.11.1.3:9100']
labels:
alias: admin2
- job_name: 'kvm1'
static_configs:
- targets: ['10.11.1.21:9100']
labels:
alias: kvm1
- job_name: 'kvm2'
static_configs:
- targets: ['10.11.1.22:9100']
labels:
alias: kvm2
- job_name: 'kvm3'
static_configs:
- targets: ['10.11.1.23:9100']
labels:
alias: kvm3
- job_name: 'k8s-master1'
static_configs:
- targets: ['10.11.1.31:9100']
labels:
alias: k8s-master1
- job_name: 'k8s-master2'
static_configs:
- targets: ['10.11.1.32:9100']
labels:
alias: k8s-master2
- job_name: 'k8s-master3'
static_configs:
- targets: ['10.11.1.33:9100']
labels:
alias: k8s-master3
- job_name: 'k8s-node1'
static_configs:
- targets: ['10.11.1.34:9100']
labels:
alias: k8s-node1
- job_name: 'k8s-node2'
static_configs:
- targets: ['10.11.1.35:9100']
labels:
alias: k8s-node2
- job_name: 'k8s-node3'
static_configs:
- targets: ['10.11.1.36:9100']
labels:
alias: k8s-node3
- job_name: 'mikrotik-exporter'
scrape_interval: 30s
static_configs:
- targets:
- 10.11.1.1 # your Mikrotik router IP you wish to monitor
metrics_path: /metrics
params:
module: [my_router]
relabel_configs:
- source_labels: [__address__]
target_label: __param_target
- source_labels: [__param_target]
target_label: instance
- target_label: __address__
replacement: mikrotik-exporter:9436
Our Prometheus config map contains Alertmanager configuration that we’ll cover in this article.
Create a Persistent Volume
We want to keep monitoring data and store it on a persistent volume.
$ kubectl apply -f ./kubernetes/prometheus/prometheus-pv.yml
This is what the code looks like:
---
apiVersion: v1
kind: PersistentVolume
metadata:
  name: nfs-pv-prometheus
  namespace: monitoring
spec:
  capacity:
    storage: 32Gi
  volumeMode: Filesystem
  accessModes:
    - ReadWriteOnce
  persistentVolumeReclaimPolicy: Retain
  storageClassName: nfs
  mountOptions:
    - hard
    - nfsvers=4.1
  nfs:
    path: /mnt/storage-k8s/nfs/prometheus
    server: 10.11.1.20
Create a Persistent Volume Claim
Allow Prometheus to request persistent storage.
$ kubectl apply -f ./prometheus/prometheus-pvc.yml
This is what the code looks like:
---
apiVersion: v1
kind: PersistentVolumeClaim
metadata:
  name: nfs-pvc-prometheus
  namespace: monitoring
spec:
  storageClassName: nfs
  accessModes:
    - ReadWriteOnce
  resources:
    requests:
      storage: 32Gi
Create a Deployment Configuration
$ kubectl apply -f ./prometheus/prometheus-deployment.yml
This is what the code looks like:
---
apiVersion: apps/v1
kind: Deployment
metadata:
  name: prometheus
  namespace: monitoring
  labels:
    app: prometheus-server
spec:
  replicas: 1
  selector:
    matchLabels:
      app: prometheus-server
  template:
    metadata:
      labels:
        app: prometheus-server
    spec:
      securityContext:
        fsGroup: 65534
        runAsGroup: 65534
        runAsNonRoot: true
        runAsUser: 65534
      containers:
        - name: prometheus
          image: prom/prometheus:v2.24.1
          imagePullPolicy: IfNotPresent
          args:
            - "--storage.tsdb.retention.time=28d"
            - "--config.file=/etc/prometheus/prometheus.yml"
            - "--storage.tsdb.path=/prometheus/"
          ports:
            - containerPort: 9090
              protocol: TCP
          resources:
            limits:
              memory: "1Gi"
              cpu: "1000m"
            requests:
              memory: "500Mi"
              cpu: "100m"
          volumeMounts:
            - name: prometheus-config-volume
              mountPath: /etc/prometheus/
              readOnly: true
            - name: prometheus-storage-volume
              mountPath: /prometheus/
      # See https://kubernetes.io/docs/concepts/workloads/pods/init-containers/
      #initContainers:
      #  - name: fix-nfs-permissions
      #    image: busybox
      #    command: ["sh", "-c", "chown -R 65534:65534 /prometheus"]
      #    securityContext:
      #      runAsUser: 0
      #      runAsNonRoot: false
      #    volumeMounts:
      #      - name: prometheus-storage-volume
      #        mountPath: /prometheus
      restartPolicy: Always
      terminationGracePeriodSeconds: 60
      volumes:
        - name: prometheus-config-volume
          configMap:
            defaultMode: 420
            name: prometheus-server-conf

        - name: prometheus-storage-volume
          persistentVolumeClaim:
            claimName: nfs-pvc-prometheus
Create a Service
$ kubectl apply -f ./prometheus/prometheus-service.yml
This is what the code looks like:
---
apiVersion: v1
kind: Service
metadata:
  name: prometheus-service
  namespace: monitoring
  annotations:
    prometheus.io/scrape: 'true'
    prometheus.io/port:   '9090'
  labels:
    app: prometheus-server
spec:
  selector:
    app: prometheus-server
  type: NodePort
  ports:
    - port: 9090
      targetPort: 9090
      nodePort: 30000
Check Monitoring Namespace
$ kubectl -n monitoring get all -l app=prometheus-server
NAME                              READY   STATUS    RESTARTS   AGE
pod/prometheus-7d8dc64fdc-2wzt2   1/1     Running   0          6d1h

NAME                         TYPE       CLUSTER-IP       EXTERNAL-IP   PORT(S)          AGE
service/prometheus-service   NodePort   10.104.220.139   none          9090:30000/TCP   14d

NAME                         READY   UP-TO-DATE   AVAILABLE   AGE
deployment.apps/prometheus   1/1     1            1           6d5h

NAME                                    DESIRED   CURRENT   READY   AGE
replicaset.apps/prometheus-7d8dc64fdc   1         1         1       6d3h
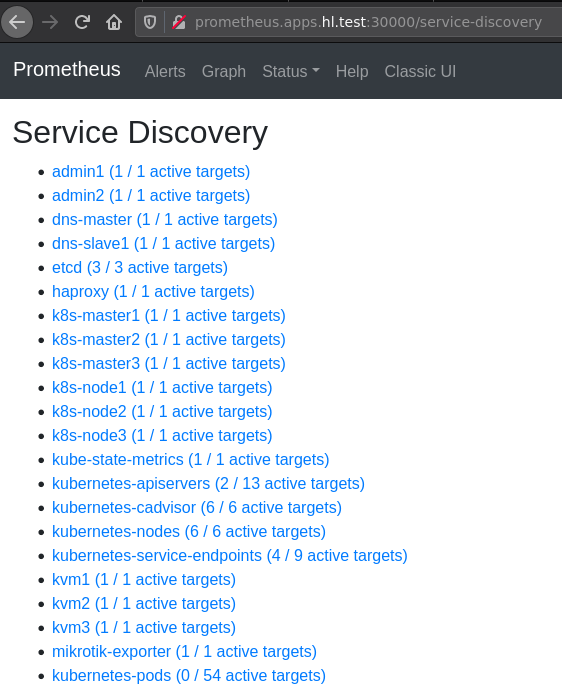
We can access the Prometheus dashboard by using its service node port 30000.
What’s Next?
We will configure Grafana to use Prometheus as a data source.