Resource and cost allocation should be a starting point before optimising Kubernetes applications.
Revision history (dd/mm/yy):
27/11/2021 – updated the article to include Kubecost findings and recommendations.
Why Kubecost?
Our homelab runs on dedicated hardware, therefore there is no Cloud provider cost involved in order to run it.
The cost of electricity is all there is to it. The average homelab power consumption is approximatelly 80W.
Monthly, this works out as follows: (((80W * 24h) / 1000) * £0.16/kWh * 365days) / 12months = £9.34 (~13$).
So why Kubecost?
It would be interesting to see monthly homelab cluster costs had it been deployed on AWS.
It would also be useful to understand whether Kubernetes applications can be optimised. There will almost always be resources that are over-provisioned. By factoring in Kubecost metrics as part of deployment process, it should be possible to leverage those insights to reduce over-provisioned Kubernetes infrastructure.
Pre-requisites
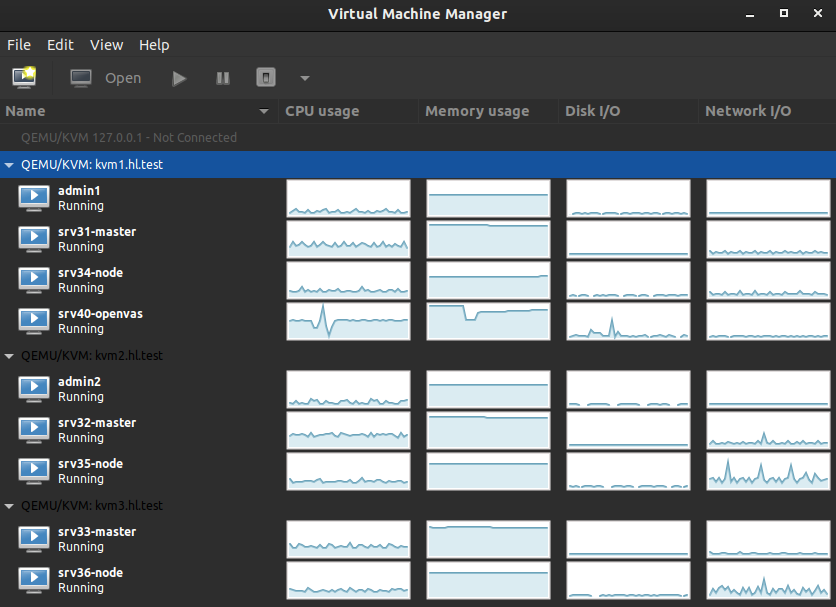
We are using our Kubernetes homelab in this article.
Prometheus deployment instructions can be found here. MetalLB deployment instructions can be found here.
Configuration files used in this article can be found on GitHub.
Create Node Labels
Kubecost uses labels to calculate an infrastructure health score.
Set a label for instance type. This would normally be set by default if we were using a Cloud provider. Since we aren’t, we can set it manually to match our instance types to those of AWS.
- c5a.large – 2 CPU cores, 4GB of RAM. These resources are allocated to our control planes.
- m5a.large – 2 CPU cores, 8GB of RAM. These resources are allocated to our worker nodes.
Apply labels:
kubectl label no --overwrite srv31 node.kubernetes.io/instance-type=c5a.large
kubectl label no --overwrite srv32 node.kubernetes.io/instance-type=c5a.large
kubectl label no --overwrite srv33 node.kubernetes.io/instance-type=c5a.large
kubectl label no --overwrite srv34 node.kubernetes.io/instance-type=m5a.large
kubectl label no --overwrite srv35 node.kubernetes.io/instance-type=m5a.large
kubectl label no --overwrite srv36 node.kubernetes.io/instance-type=m5a.large
Set a label for zone. A zone represents a logical failure domain. Zone names can be anything, for the sake of this excercise we’re going to match those of AWS. In our case the following logical failure domains can be identified:
- kvm1.hl.test host – zone eu-west-2a,
- kvm2.hl.test host – zone eu-west-2b,
- kvm3.hl.test host – zone eu-west-2c.
Apply labels:
kubectl label no --overwrite srv31 topology.kubernetes.io/zone=eu-west-2a
kubectl label no --overwrite srv32 topology.kubernetes.io/zone=eu-west-2b
kubectl label no --overwrite srv33 topology.kubernetes.io/zone=eu-west-2c
kubectl label no --overwrite srv34 topology.kubernetes.io/zone=eu-west-2a
kubectl label no --overwrite srv35 topology.kubernetes.io/zone=eu-west-2b
kubectl label no --overwrite srv36 topology.kubernetes.io/zone=eu-west-2c

kubectl label no --overwrite srv31 failure-domain.beta.kubernetes.io/zone=eu-west-2a
kubectl label no --overwrite srv32 failure-domain.beta.kubernetes.io/zone=eu-west-2b
kubectl label no --overwrite srv33 failure-domain.beta.kubernetes.io/zone=eu-west-2c
kubectl label no --overwrite srv34 failure-domain.beta.kubernetes.io/zone=eu-west-2a
kubectl label no --overwrite srv35 failure-domain.beta.kubernetes.io/zone=eu-west-2b
kubectl label no --overwrite srv36 failure-domain.beta.kubernetes.io/zone=eu-west-2c
Set a label for region. A region represents a larger domain, made up of one or more zones. In our case we have three zones (three KVM hypervisors), but only a single region (all hypervisors are hosted in the same homelab). Region names can be anything, for the sake of this excercise we’re going to use eu-west-2, which is an AWS region for Europe (London).
kubectl label no --overwrite srv31 topology.kubernetes.io/region=eu-west-2
kubectl label no --overwrite srv32 topology.kubernetes.io/region=eu-west-2
kubectl label no --overwrite srv33 topology.kubernetes.io/region=eu-west-2
kubectl label no --overwrite srv34 topology.kubernetes.io/region=eu-west-2
kubectl label no --overwrite srv35 topology.kubernetes.io/region=eu-west-2
kubectl label no --overwrite srv36 topology.kubernetes.io/region=eu-west-2

kubectl label no --overwrite srv31 failure-domain.beta.kubernetes.io/region=eu-west-2
kubectl label no --overwrite srv32 failure-domain.beta.kubernetes.io/region=eu-west-2
kubectl label no --overwrite srv33 failure-domain.beta.kubernetes.io/region=eu-west-2
kubectl label no --overwrite srv34 failure-domain.beta.kubernetes.io/region=eu-west-2
kubectl label no --overwrite srv35 failure-domain.beta.kubernetes.io/region=eu-west-2
kubectl label no --overwrite srv36 failure-domain.beta.kubernetes.io/region=eu-west-2
Install Kubecost Using Helm
The Kubecost helm chart includes all dependencies required to get the service up and running.
Add Helm Repository
Helm client (version 3) required.
$ helm repo add kubecost https://kubecost.github.io/cost-analyzer/
Deploy Kubecost
Create kubecost namespace:
$ kubectl create namespace kubecost
We are going to integrate Kubecost with the following existing homelab services: TrueNAS, Prometheus and node exporter. We have to do the following:
- Set
prometheus.enabledtofalse, - Set
prometheus.nodeExporter.enabledtofalse, - Set
prometheus.fqdnparameter to match our local Prometheus service address, - Set
persistentVolume.storageClasstofreenas-nfs-csi, - Configure our Prometheus to scrape the cost-model
/metricsendpoint, - Add Prometheus recording rules to enable certain Kubecost features.
Install:
$ helm upgrade --install kubecost kubecost/cost-analyzer \
  --namespace kubecost \
  --set global.prometheus.enabled=false \
  --set global.prometheus.fqdn="http://prometheus-service.monitoring.svc:9090" \
  --set global.grafana.enabled=true \
  --set kubecostModel.imagePullPolicy="IfNotPresent" \
  --set kubecostFrontend.imagePullPolicy="IfNotPresent" \
  --set networkCosts.enabled=true \
  --set networkCosts.imagePullPolicy="IfNotPresent" \
  --set persistentVolume.enabled=true \
  --set persistentVolume.size="10Gi" \
  --set persistentVolume.storageClass="freenas-nfs-csi" \
  --set prometheus.nodeExporter.enabled=false \
  --set prometheus.server.persistentVolume.enabled=false
Create LoadBalancer Service
Create a file kubecost-service.yaml and add the following:
---
apiVersion: v1
kind: Service
metadata:
  name: kubecost-service
  namespace: kubecost
  labels:
    app: cost-analyzer
spec:
  selector:
    app: cost-analyzer
  type: LoadBalancer
  ports:
    - protocol: TCP
      port: 80
      targetPort: 9090
This will create a LoadBalancer type service (which uses MetalLB) to expose Kubecost to the network:
$ git clone https://github.com/lisenet/kubernetes-homelab.git
$ kubectl apply -f ./kubernetes-homelab/kubernetes/helm/kubecost/kubecost-service.yaml
Kubecost should be deployed:
$ kubectl get svc -n kubecost
NAME                          TYPE           CLUSTER-IP       EXTERNAL-IP   PORT(S)                      AGE
kubecost-cost-analyzer        ClusterIP      10.102.128.194   none          9001/TCP,9003/TCP,9090/TCP   2d18h
kubecost-grafana              ClusterIP      10.109.228.51    none          80/TCP                       2d4h
kubecost-kube-state-metrics   ClusterIP      10.106.178.102   none          8080/TCP                     2d18h
kubecost-service              LoadBalancer   10.102.54.33     10.11.1.52    80:31527/TCP                 12d
The frontend can be accessed by visiting the LoadBalancer external IP.
Update Prometheus Configuration for Kubecost
Add the following to Prometheus ConfigMap file prometheus-config-map.yml to configure Prometheus to scrape the cost-model /metrics endpoint:
      #--------------------------------------------
      # Scrape the cost-model /metrics endpoint.
      #--------------------------------------------
      - job_name: 'kubecost'
        honor_labels: true
        scrape_interval: 1m
        scrape_timeout: 10s
        metrics_path: /metrics
        scheme: http
        dns_sd_configs:
        - names:
          - kubecost-cost-analyzer.kubecost
          type: 'A'
          port: 9003
Also add Prometheus recording rules (see here):
    - name: CPU
      rules:
      - expr: sum(rate(container_cpu_usage_seconds_total{container_name!=""}[5m]))
        record: cluster:cpu_usage:rate5m
      - expr: rate(container_cpu_usage_seconds_total{container_name!=""}[5m])
        record: cluster:cpu_usage_nosum:rate5m
      - expr: avg(irate(container_cpu_usage_seconds_total{container_name!="POD", container_name!=""}[5m])) by (container_name,pod_name,namespace)
        record: kubecost_container_cpu_usage_irate
      - expr: sum(container_memory_working_set_bytes{container_name!="POD",container_name!=""}) by (container_name,pod_name,namespace)
        record: kubecost_container_memory_working_set_bytes
      - expr: sum(container_memory_working_set_bytes{container_name!="POD",container_name!=""})
        record: kubecost_cluster_memory_working_set_bytes
    - name: Savings
      rules:
      - expr: sum(avg(kube_pod_owner{owner_kind!="DaemonSet"}) by (pod) * sum(container_cpu_allocation) by (pod))
        record: kubecost_savings_cpu_allocation
        labels:
          daemonset: "false"
      - expr: sum(avg(kube_pod_owner{owner_kind="DaemonSet"}) by (pod) * sum(container_cpu_allocation) by (pod)) / sum(kube_node_info)
        record: kubecost_savings_cpu_allocation
        labels:
          daemonset: "true"
      - expr: sum(avg(kube_pod_owner{owner_kind!="DaemonSet"}) by (pod) * sum(container_memory_allocation_bytes) by (pod))
        record: kubecost_savings_memory_allocation_bytes
        labels:
          daemonset: "false"
      - expr: sum(avg(kube_pod_owner{owner_kind="DaemonSet"}) by (pod) * sum(container_memory_allocation_bytes) by (pod)) / sum(kube_node_info)
        record: kubecost_savings_memory_allocation_bytes
        labels:
          daemonset: "true"
      - expr: label_replace(sum(kube_pod_status_phase{phase="Running",namespace!="kube-system"} > 0) by (pod, namespace), "pod_name", "$1", "pod", "(.+)")
        record: kubecost_savings_running_pods
      - expr: sum(rate(container_cpu_usage_seconds_total{container_name!="",container_name!="POD",instance!=""}[5m])) by (namespace, pod_name, container_name, instance)
        record: kubecost_savings_container_cpu_usage_seconds
      - expr: sum(container_memory_working_set_bytes{container_name!="",container_name!="POD",instance!=""}) by (namespace, pod_name, container_name, instance)
        record: kubecost_savings_container_memory_usage_bytes
      - expr: avg(sum(kube_pod_container_resource_requests{resource="cpu", unit="core", namespace!="kube-system"}) by (pod, namespace, instance)) by (pod, namespace)
        record: kubecost_savings_pod_requests_cpu_cores
      - expr: avg(sum(kube_pod_container_resource_requests{resource="memory", unit="byte", namespace!="kube-system"}) by (pod, namespace, instance)) by (pod, namespace)
        record: kubecost_savings_pod_requests_memory_bytes
Update Prometheus deployment:
$ kubectl apply -f ./kubernetes-homelab/kubernetes/prometheus/
What’s Next?
We are going to leave Kubecost running for some time to allow it to gather metrics. We will then review the results to see if request sizing recommendations are available.
These are the on-demand plans for Amazon EC2 (correct at the time of writing):
- c5a.large – on-demand hourly rate $0.091 in Europe (London),
- m5a.large – on-demand hourly rate $0.10 in Europe (London).
A single control plane would cost $0.091*24h*30d = $65.52/month, or $196.56/month for three of them.
A single worker node would cost $0.10*24h*30d = $72.00/month, or $216.00/month for three of them.
In total, it would cost us at least $412.56/month to run this kubernetes homelab on AWS using on-demand EC2 instances (this does not include costs for storage and networking).
We’ll check what monthly cost gets reported by Kubecost.
Kubecost Findinds
This section was added on 27/11/2021.
It has been a month, and the results are finally in.
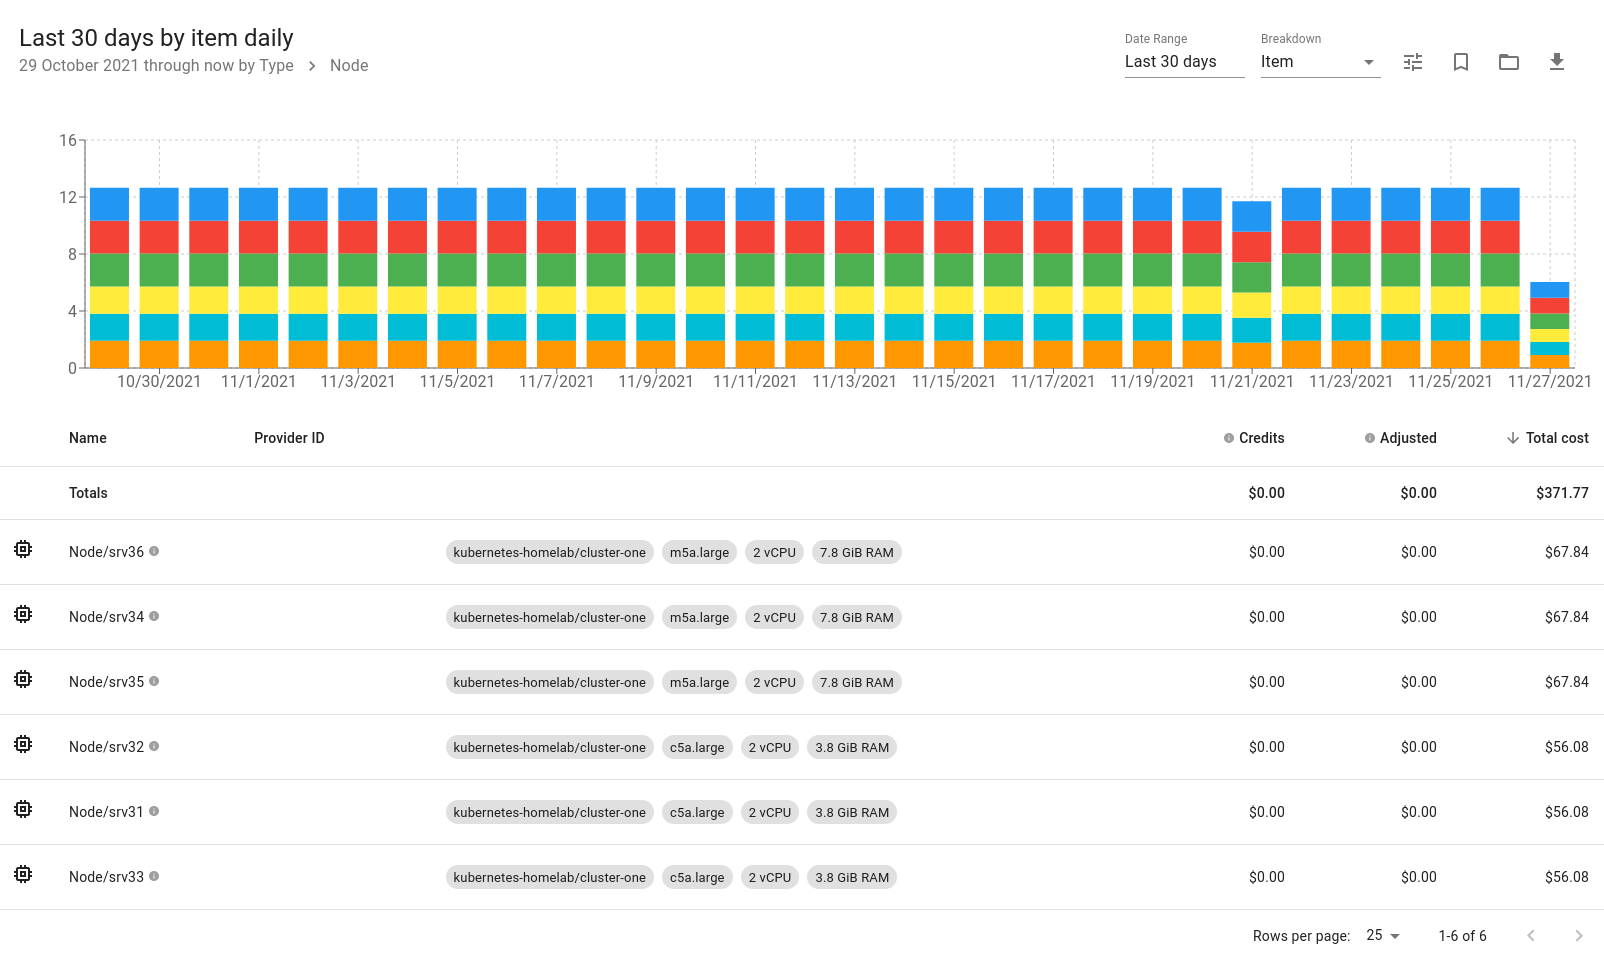
Monthly Costs
Reported monthly costs of $390 is very close to what we have estimated previously ($412).

We can see how cost is spread based on individual items. No surprise here, worker nodes are more expensive than control planes because they have more memory.
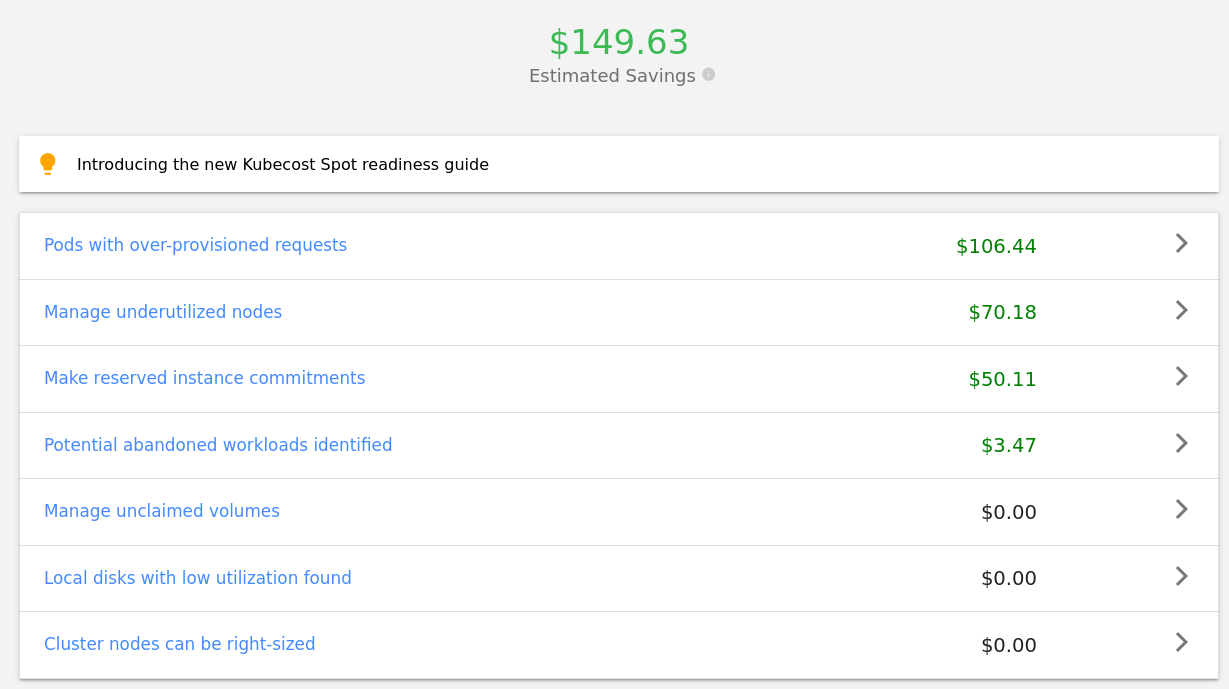
Savings and Request Sizing
Pods with over-provisioned requests are something that we should look into.
Some worker nodes are underutilised because we don’t have many/heavy Kubernetes resources deployed there.
If we were to host on AWS, we would most likely make reserved instance commitments to reduce costs. This isn’t applicable to the homelab environment unfortunatelly.
Based on request sizing recommendations, the top 5 services that would bring the most savings are: istiod, grafana, metallb speaker, wordpress and istio-proxy.
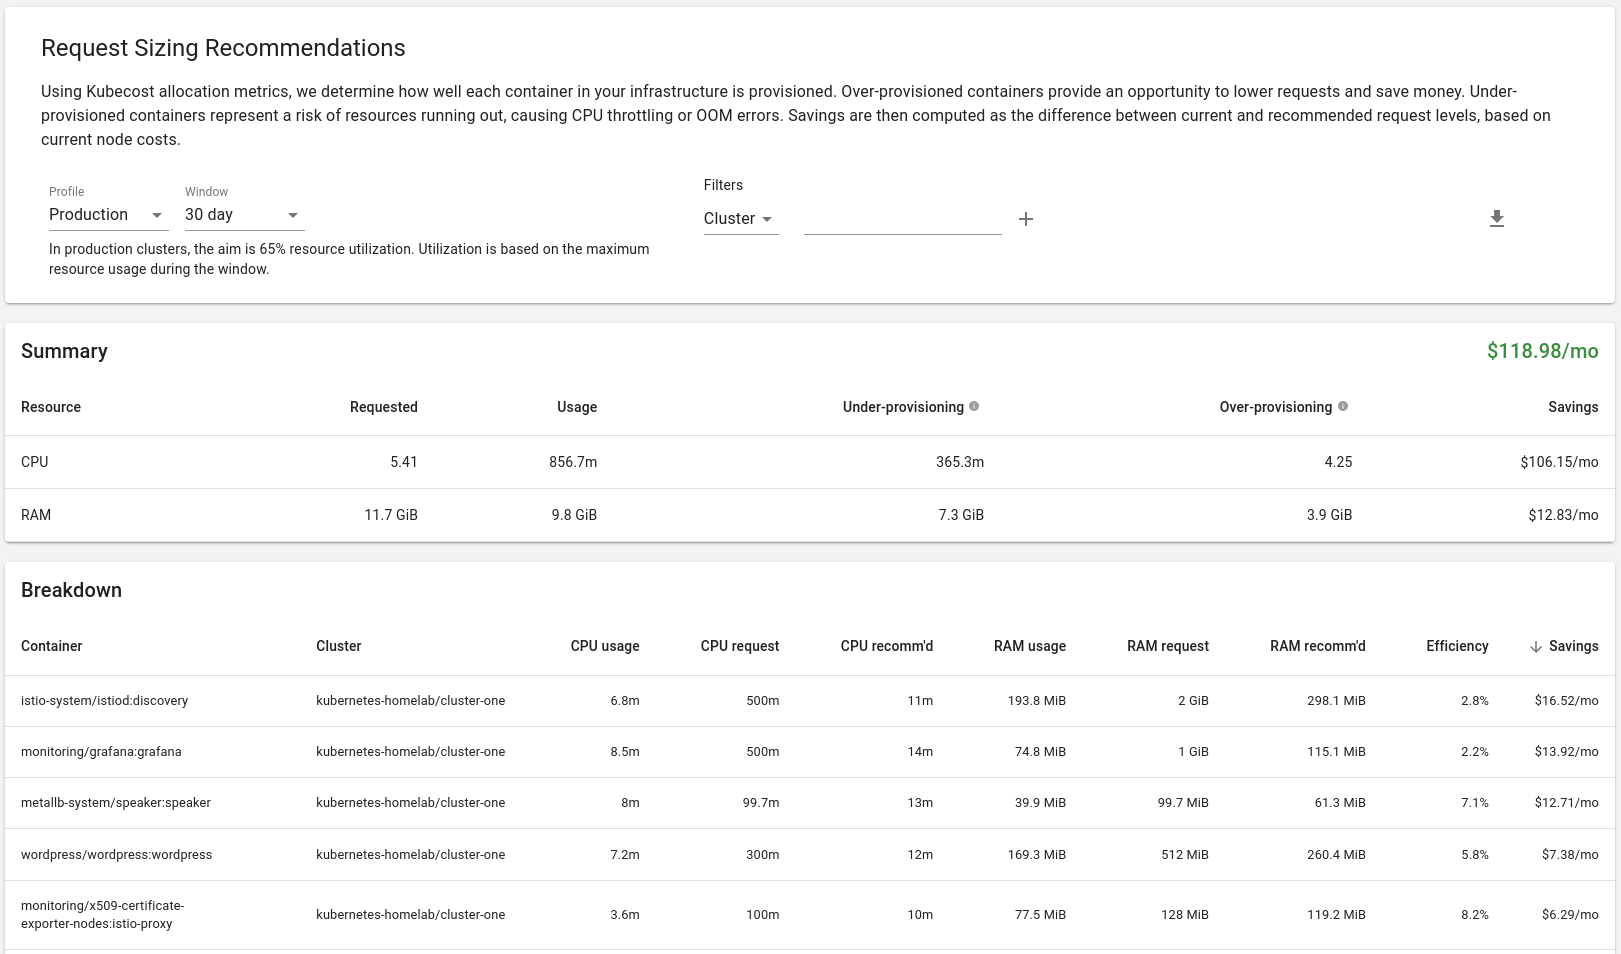
These recommendations have been addressed and changes made on GitHub.
References
https://github.com/kubecost/cost-analyzer-helm-chart
Hello Tomas thank you for everything, you have very interesting posts and I want to learn more but I do not understand English well, for which I have to use Google Translate to translate copied text. If it is possible to enable the google chrome extension TRANSLATE THIS PAGE functionality
Hi David, sure thing, you can use a browser plugin to translate the website.
Hi
is it possible to have a manifets to install kubecost to use the existing prometheus and grafana
help is very much appreciated
Hi, yes, it is possible to use your existing Prometheus and Grafana. Have a look at the configuration provided in the article, it’s this line that you want to change in order to point Kubecost to your instance of Prometheus: