Tracking down CPU usage and identifying heavy processes on a Debian Linux server.
Install Performance Monitoring Tools
Install sysstat and htop:
# apt-get update && apt-get install sysstat htop
For RHEL/CentOS, do the following (must have EPEL repository enabled):
# yum install -y sysstat htop
The sysstat package contains the following system performance tools:
- sar: collects and reports system activity information.
- iostat: reports CPU utilization and disk I/O statistics.
- mpstat: reports global and per-processor statistics.
- pidstat: reports statistics for Linux tasks (processes).
- sadf: displays data collected by sar in various formats.
- nfsiostat: reports I/O statistics for network filesystems.
- cifsiostat: reports I/O statistics for CIFS filesystems.
Make sure that sar is enabled in /etc/default/sysstat. If not enabled, do it.
You may also want to change the history value in /etc/sysstat/sysstat to something different than 7 days:
HISTORY=60
Note that if value is greater than 28, then log files will be kept in multiple directories, one for each month.
By default sysstat will collect data every 10 minutes. You can change this by modifying the cronjob /etc/cron.d/sysstat.
Finally, restart the service:
# service sysstat restart
Measure CPU Usage
CPU Usage with top and htop
The top program provides a dynamic real-time view of a running system. It’s very useful for determining processes which use the most CPU (and not just that) at the time of monitoring. To sort output by CPU, use a “Ctrl”+”P” combination.
As may be seen below (in red), the dd command, run by user sandy, is utilising 66% of all CPU resources.
$ top
top - 20:53:16 up 3 days, 21:08,  2 users,  load average: 0.86, 0.66, 0.32
Tasks: 127 total,   2 running, 124 sleeping,   0 stopped,   1 zombie
%Cpu(s):  7.0 us, 24.7 sy, 0.0 ni, 48.9 id, 17.7 wa, 0.0 hi, 1.6 si, 0.0 st
KiB Mem:   1022744 total,  1008568 used,    14176 free,      584 buffers
KiB Swap:   991228 total,   105604 used,   885624 free,   662508 cached

  PID USER      PR  NI  VIRT  RES  SHR S  %CPU %MEM    TIME+  COMMAND
29390 sandy     20   0  3536  560  472 R  66.0  0.1   0:10.54 dd
   23 root      20   0     0    0    0 S   5.3  0.0   1:22.64 kswapd0
 2860 mysql     20   0  321m 164m 2992 S   0.7 16.5  68:55.36 mysqld
29370 sandy     20   0  4512 1348  952 R   0.7  0.1   0:02.09 top
 1923 root      20   0  279m  96m  984 S   0.3  9.7  53:45.61 nessusd
 1945 root      20   0  2052  424  352 S   0.3  0.0   1:19.69 vnstatd
 2642 zabbix    20   0  3036  572  508 S   0.3  0.1   7:45.23 zabbix_agentd
 3103 zabbix    20   0 59872 9512 9216 S   0.3  0.9   4:07.73 zabbix_server
 3147 www-data  20   0 24132 1080  896 S   0.3  0.1   6:15.05 zmdc.pl
29346 sandy     20   0  9452 1492  816 S   0.3  0.1   0:00.35 sshd
Line 3, marked in blue, shows CPU state percentages based on the interval since the last refresh. Values are as follows (as per man page):
- us: time running un-niced user processes.
- sy: time running kernel processes.
- ni: time running niced user processes.
- id: time spent idle.
- wa: time waiting for I/O completion.
- hi: time spent servicing hardware interrupts.
- si: time spent servicing software interrupts.
- st: time stolen from this vm by the hypervisor.
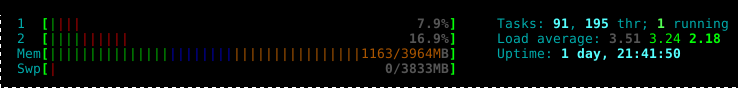
Htop is an interactive process viewer, similar to top. The head bit of htop is presented below:
CPU Usage with ps
The ps command displays information about a selection of the active processes. While top gives a dynamic real-time view of system resources, ps shows a snapshot of the currently running processes. The ps command is usually a number one tool for identifying users who drain the most CPU at current moment.
There are three different kinds of options which can be passed to ps:
- UNIX. These are preceded by a dash (standard syntax).
- BSD. These must not be used with a dash.
- GNU long options. These are preceded by two dashes.
Get a snapshot of the 9 most CPU consuming processes:
$ ps -eo pid,user,s,pcpu,comm --sort -pcpu | head
  PID USER     S %CPU COMMAND
 3360 zabbix   S  1.3 zabbix_server
 2041 root     S  1.2 nessusd
 3059 mysql    S  1.2 mysqld
 2395 clamav   S  0.3 freshclam
 2159 root     S  0.1 /usr/bin/monitorix
 2876 zabbix   S  0.1 zabbix_agentd
 2877 zabbix   S  0.1 zabbix_agentd
 2878 zabbix   S  0.1 zabbix_agentd
 2879 zabbix   S  0.1 zabbix_agentd
Parameters used are as below:
- -e: select all processes.
- -o: specify user-defined format.
- pid: process ID.
- user: user name.
- s: minimal state display (one character).
- S for sleeping (idle).
- R for running.
- D for disk sleep (uninterruptible).
- Z for zombie (waiting for parent to read it’s exit status).
- T for traced or suspended (e.g by SIGTSTP).
- W for paging.
- pcpu: cpu utilisation.
- comm: command name (only the executable name).
- —sort -pcpu: sort pcpu in descending numerical order.
CPU Usage with mpstat
The mpstat command reports activities for each available processor as well as global CPU activities. In my personal opinion, mpstat gives one the most informative outputs when troubleshooting CPU leakage.
Display three CPU utilisation (-u) reports at one second intervals:
$ mpstat -u 1 3
Linux 3.2.0-4-686-pae (flames) 	20/02/14        _i686_	(2 CPU)

19:43:03     CPU    %usr   %nice    %sys %iowait    %irq   %soft  %steal  %guest   %idle
19:43:04     all    4.86    0.00   26.49   16.22    0.54    1.62    0.00    0.00   50.27
19:43:05     all    8.33    0.00   24.44   16.11    0.00    1.11    0.00    0.00   50.00
19:43:06     all    6.67    0.00   24.44   17.78    0.00    1.11    0.00    0.00   50.00
Average:     all    6.61    0.00   25.14   16.70    0.18    1.28    0.00    0.00   50.09
The following values are shown (as per man page):
- CPU: processor number. The keyword all indicates that statistics are calculated as averages among all processors.
- %usr: show the percentage of CPU utilisation that occurred while executing at the user level (application).
- %nice: show the percentage of CPU utilisation that occurred while executing at the user level with nice priority.
- %sys: show the percentage of CPU utilisation that occurred while executing at the system level (kernel). Note that this does not include time spent servicing hardware and software interrupts.
- %iowait: show the percentage of time that the CPU or CPUs were idle during which the system had an outstanding disk I/O request.
- %irq: show the percentage of time spent by the CPU or CPUs to service hardware interrupts.
- %soft: show the percentage of time spent by the CPU or CPUs to service software interrupts.
- %steal: show the percentage of time spent in involuntary wait by the virtual CPU or CPUs while the hypervisor was servicing another virtual processor.
- %guest: show the percentage of time spent by the CPU or CPUs to run a virtual processor.
- %idle: show the percentage of time that the CPU or CPUs were idle and the system did not have an outstanding disk I/O request.
On multiprocessor systems, we can specify the processors we want to get the report for by passing a -P parameter and specifying a processor’s number.
Display three per-processor (-P) CPU reports for processors 0 and 1 at one second intervals:
$ mpstat -P 0,1 1 3
Linux 3.2.0-4-686-pae (flames) 	20/02/14        _i686_	(2 CPU)

19:43:16     CPU    %usr   %nice    %sys %iowait    %irq   %soft  %steal  %guest   %idle
19:43:17       0   21.98    0.00   62.64   14.29    0.00    1.10    0.00    0.00    0.00
19:43:17       1    0.00    0.00   11.11    0.00    0.00    0.00    0.00    0.00   88.89
19:43:18       0   20.65    0.00   61.96   15.22    0.00    1.09    0.00    0.00    1.09
19:43:18       1    2.04    0.00   10.20    7.14    0.00    0.00    0.00    0.00   80.61
19:43:19       0   18.89    0.00   66.67   14.44    0.00    0.00    0.00    0.00    0.00
19:43:19       1    1.02    0.00    8.16    0.00    0.00    0.00    0.00    0.00   90.82
Average:       0   20.51    0.00   63.74   14.65    0.00    0.73    0.00    0.00    0.37
Average:       1    1.02    0.00    9.83    2.37    0.00    0.00    0.00    0.00   86.78
So CPU 1, marked in blue, is chilling while CPU 0, marked in red, is doing some work.
CPU Usage with iostat
The iostat command can report CPU statistics as well as I/O statistics for devices and partitions. For multiprocessor systems, the CPU values are global averages among all processors. The iostat command doesn’t report per-processor usage. I would describe iostat as an inferior, or perhaps, simplified version of mpstat when talking about CPU resource monitoring.
Display three CPU reports (-c) at one second intervals:
$ iostat -c 1 3
Linux 3.2.0-4-686-pae (flames) 	20/02/14        _i686_	(2 CPU)

avg-cpu:  %user   %nice %system %iowait  %steal   %idle
           1.59    0.68    0.70    0.55    0.00   96.47

avg-cpu:  %user   %nice %system %iowait  %steal   %idle
           9.68    0.00   32.80   10.22    0.00   47.31

avg-cpu:  %user   %nice %system %iowait  %steal   %idle
           8.60    0.00   35.48    8.06    0.00   47.85
Note that the first line gives averages since the last reboot. The CPU report has the following format (as per man page):
- %user: show the percentage of CPU utilisation that occurred while executing at the user level (application).
- %nice: show the percentage of CPU utilisation that occurred while executing at the user level with nice priority.
- %system: show the percentage of CPU utilisation that occurred while executing at the system level (kernel).
- %iowait: show the percentage of time that the CPU or CPUs were idle during which the system had an outstanding disk I/O request.
- %steal: show the percentage of time spent in involuntary wait by the virtual CPU or CPUs while the hypervisor was servicing another virtual processor.
- %idle: show the percentage of time that the CPU or CPUs were idle and the system did not have an outstanding disk I/O request.
CPU Usage with vmstat
The vmstat command reports information about many resource activities including CPU, processes, memory, paging, block IO and disks activity. Note that the first reported line gives averages since the last reboot. Default output shows memory in KB (1024B).
The vmstat command gives the least detailed CPU reports compared with mpstat or iostat, but is usually a number one tool for getting an overall overview of what’s happening on a system right now.
Display three reports at one second intervals:
$ vmstat 1 3
procs -----------memory---------- ---swap-- -----io---- -system-- ----cpu----
 r  b   swpd   free   buff  cache   si   so    bi    bo   in   cs us sy id wa
 0  1  69188  13436  47032 589176    0    0    63   106  110   40  2  1 96  1
 1  0  69188  13700  47032 588840    0    0 113920     0 1642 2231 9 35 48  7
 1  0  69188  13204  47032 589516    0    0 112256     0 1633 2252 9 37 47  7
CPU activity is marked in blue. Numbers are percentages of total CPU time. Time values are (as per man page):
- us: time spent running non-kernel code (user time, including nice time).
- sy: time spent running kernel code (system time).
- id: time spent idle. Prior to Linux 2.5.41, this includes IO-wait time.
- wa: time spent waiting for IO. Prior to Linux 2.5.41, included in idle.
- st: time stolen from a virtual machine, if present. Prior to Linux 2.6.11, unknown.
CPU Usage with sar
The sar command gives the report of selected resource activity counters in the system.
As per man page, sar can write information the specified number of times spaced at the specified intervals in seconds. If the interval parameter is set to zero, the sar command displays the average statistics for the time since the system was started. This is extremely helpful for analysing historical data and for future resource capacity planning.
Display three real-time CPU utilisation (-u) reports at one second intervals:
$ sar -u 1 3
Linux 3.2.0-4-686-pae (flames) 	20/02/14        _i686_	(2 CPU)

19:18:02        CPU     %user     %nice   %system   %iowait    %steal     %idle
19:18:03        all      7.94      0.00     35.45      8.47      0.00     48.15
19:18:04        all      6.74      0.00     39.90      7.77      0.00     45.60
19:18:05        all      9.14      0.00     34.95      8.06      0.00     47.85
Average:        all      7.92      0.00     36.80      8.10      0.00     47.18
The report shows the following fields (as per man page):
- %user: percentage of CPU utilisation that occurred while executing at the user level (application). Note that this field includes time spent running virtual processors.
- %nice: percentage of CPU utilisation that occurred while executing at the user level with nice priority.
- %system: percentage of CPU utilisation that occurred while executing at the system level (kernel). Note that this field includes time spent servicing hardware and software interrupts.
- %iowait: percentage of time that the CPU or CPUs were idle during which the system had an outstanding disk I/O request.
- %steal: percentage of time spent in involuntary wait by the virtual CPU or CPUs while the hypervisor was servicing another virtual processor.
- %idle: percentage of time that the CPU or CPUs were idle and the system did not have an outstanding disk I/O request.
The ALL keyword (-u ALL) can be used to display all CPU fields. For example, “sar -u ALL 1 3” should produce the same report as “mpstat -u 1 3“.
Extract historical CPU utilisation (-u) records starting (-s) 1 PM and ending (-e) 2 PM time interval:
$ sar -u -s 13:00:00 -e 14:00:00
Linux 3.2.0-4-686-pae (flames) 	20/02/14        _i686_	(2 CPU)

13:05:01        CPU     %user     %nice   %system   %iowait    %steal     %idle
13:15:01        all      0.69      0.00      0.53      0.47      0.00     98.30
13:25:01        all      0.71      0.00      0.54      0.36      0.00     98.39
13:35:01        all      1.49      0.00      0.53      0.30      0.00     97.68
13:45:01        all      0.64      0.00      0.54      0.30      0.00     98.53
13:55:01        all      0.65      0.00      0.51      0.28      0.00     98.56
Average:        all      0.84      0.00      0.53      0.34      0.00     98.29
Extract historical per-processor (-P) statistics for processors 0 and 1 starting (-s) 1 PM and ending (-e) 2 PM time interval:
$ sar -P 0,1 -s 13:00:00 -e 14:00:00
Linux 3.2.0-4-686-pae (flames) 	20/02/14        _i686_	(2 CPU)

13:05:01        CPU     %user     %nice   %system   %iowait    %steal     %idle
13:15:01          0      0.69      0.00      0.53      0.92      0.00     97.86
13:15:01          1      0.69      0.00      0.53      0.03      0.00     98.75
13:25:01          0      0.67      0.00      0.55      0.70      0.00     98.08
13:25:01          1      0.75      0.00      0.53      0.02      0.00     98.70
13:35:01          0      2.30      0.00      0.53      0.57      0.00     96.59
13:35:01          1      0.68      0.00      0.53      0.03      0.00     98.76
13:45:01          0      0.63      0.00      0.50      0.58      0.00     98.29
13:45:01          1      0.65      0.00      0.57      0.02      0.00     98.77
13:55:01          0      0.64      0.00      0.48      0.55      0.00     98.33
13:55:01          1      0.65      0.00      0.54      0.01      0.00     98.79
Average:          0      0.99      0.00      0.52      0.66      0.00     97.83
Average:          1      0.69      0.00      0.54      0.02      0.00     98.75
Stats for previous days can be displayed by extracting records from log files (-f) which are stored under /var/log/sysstat/. For example, to get CPU stats for 18th of February, we would do:
$ sar -u -f /var/log/sysstat/sa18
Sar is irreplaceable tool for future capacity planning. Check sar’s man page for more info.
Related Posts
Measure and Troubleshoot Linux Memory Resource Usage
Measure and Troubleshoot Linux Disk I/O Resource Usage
Measure and Troubleshoot Linux Network Resource Usage
in CentOS 7.5 the directory for the saXX files is /var/log/sa/ not /var/log/sysstat
I’m aware of that, thanks. This article was originally written with a Debian based system in mind.
Use of mpstat command